
Dashboard Guide
Read your dashboard at a glance and know which number actually tells you something.
The dashboard is the first thing you see, and it is built to answer one question: is the operation healthy right now? Here is what each block means and which ones are worth watching.
Pipeline value by stage
This is the money view. It shows how much is sitting in each stage of your pipeline, so you can see whether deals are piling up somewhere and going stale. If one stage is bloated, that is usually where your process is leaking.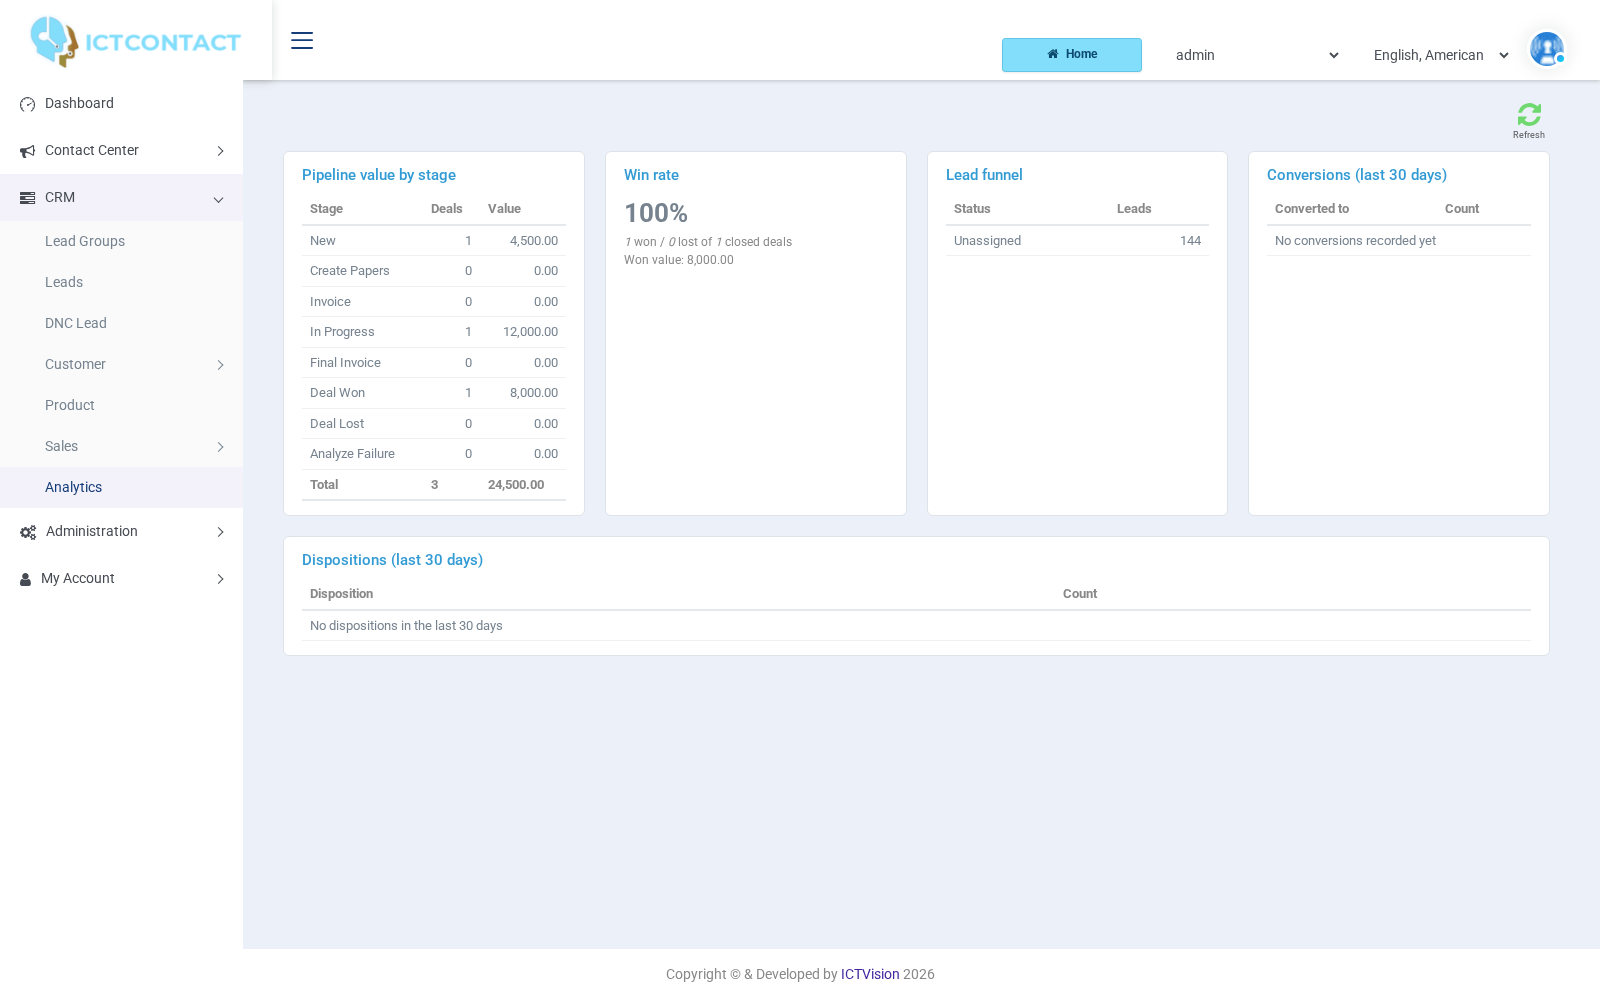
Win rate and lead funnel
Win rate is the honest scoreboard: of the deals that closed, how many you won. The lead funnel shows how contacts move from new to qualified to converted, so a narrow point in the funnel tells you where prospects drop off.
Top dispositions
The last 30 days of call outcomes, ranked. This is the one people underrate. If "no answer" dominates, your list or your calling times need work. If "not interested" dominates, the pitch or the targeting does. The dashboard will not fix it, but it points you at the right problem.
Live call activity
Answered, failed and in-progress calls update in real time while a campaign runs, so you can tell within seconds whether something has gone wrong with a trunk or a list rather than finding out at the end of the day.
Want to see it on your own calls?Try the live demoSee pricing